Before opening your live trading account in a brokerage like Trade Zero, you should understand the importance of risk vs reward and the concept of calculating it. Risk management is the most important building block of successful trading. We all buy stocks hoping to build wealth, but sometimes we forget that before trading with our hard-earned cash we need to think about how to avoid losing it!
What is the Risk vs Reward Ratio?
The Risk-Reward Ratio is the ratio used to compare expected returns against the amount of risk taken.
In line with market convention, risk-reward ratios are expressed in terms of total reward per one unit of risk. It is important to note that even though it’s called a risk-reward ratio, the ratio is conventionally stated with the reward figure first.
So, when the risk in question is 1 and the reward is 2, the ratio is stated as 2:1, rather than 1:2.
What is Risk vs Reward or “RR”?
The common term RR stands for "Risk vs Reward". When someone refers to, for example, a trade making 3R, they are referring to the trade making 3x their planned risk on the trade.
Risk vs Reward Trade Example
If you buy 100 shares of a stock at $100 with the expectation that it will go up to $120, your expected reward is $200. If the protective stop on the position is placed at $80 the risk-reward ratio is 1:1. This means that you are risking $200 to make $200. But if the protective stop is placed at $90, then the risk-reward ratio is 2:1. Now you are risking $100 to make $200. This can also be expressed as "2R" meaning 2 times your risk.
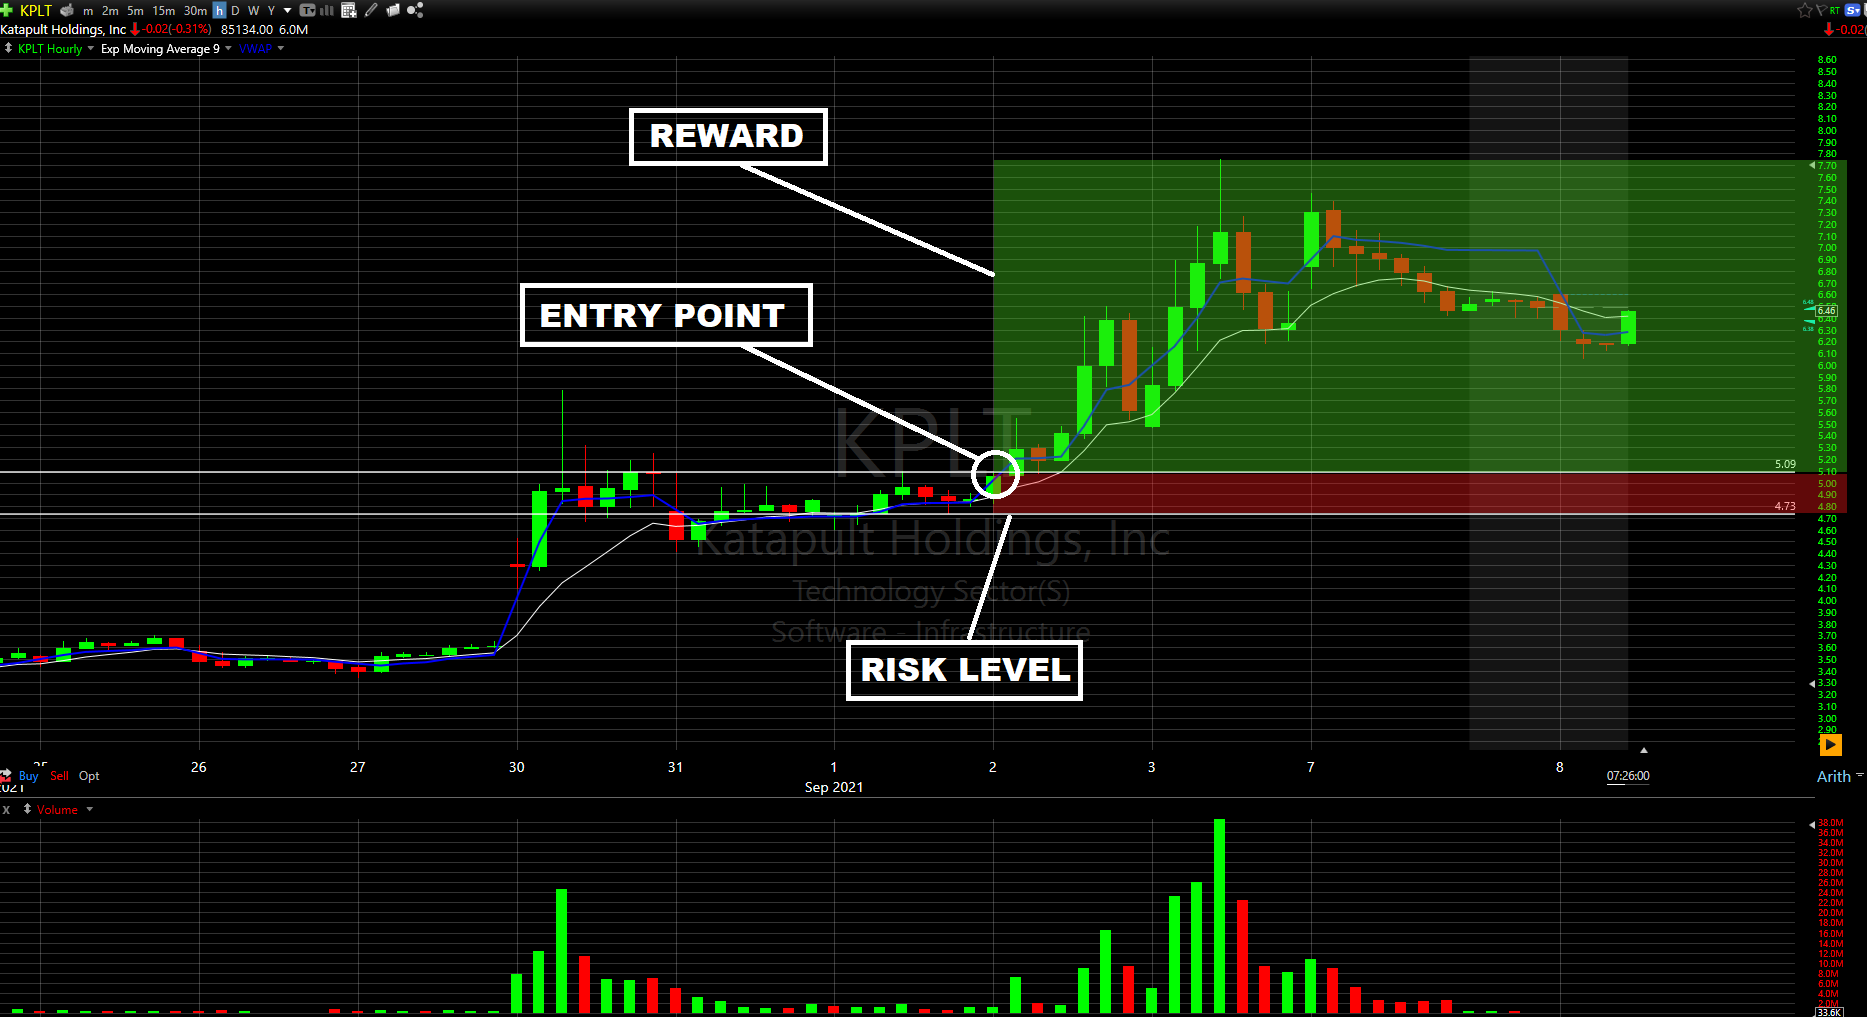
In this example below, a trader is buying the breakout at $5.09 with a stop loss (risk level) at $4.73 support.
This trader is risking 36 cents per share (the difference between the entry point and the stop loss). If the trader sells the position, for example, 72 cents higher than they bought it, they made "2R" on the trade (2 x risk).
On the other hand, if someone expresses they have lost 1R, it means they lost what they were risking on the trade.
Who Uses Risk-Reward Ratios?
Anyone who aims to be a consistently successful trader. Many people who use candlestick charting to indicate their buy and sell signals use a defined trading methodology using risk vs reward profiles, using the chart patterns and support levels to determine where to enter the trade and where to exit for profit or loss.
Defining Your Trading Strategy
Here we will play with probabilities to understand the ratios a little better.
Let’s say that your prediction is right 70% of the time using a 1:1 risk-reward ratio. Thus, after 10 trades, seven were closed with a $100 profit and three trades were stopped with a $100 loss. Adding the results, you are getting away with a $400 profit.
Now let's make the same calculations but with different values. Instead of being right 70% of the time, you are right just 40% of the time. Now out of 10 trades you only are profitable in 4 trades but, now you are using a 3:1 ratio for the same profit of $100. Adding your 4 winning trades you get a $1200 profit and adding your 6 losing trades you get a $600 loss.
With this strategy, you are getting away with a $600 gain by being right fewer times but with a better risk-reward ratio. Compare that with the other strategy and you are making more money.
| Risk- Reward Ratios | Breakeven Winning Rate | |
| 1:1 | 50% | |
| 2:1 | 33% | |
| 3:1 | 25% | |
| 5:1 | 17% | |
| 10:1 | 9% |
This difference shows the importance of the use of risk-reward ratios in trading. It is nearly impossible to be right all the time but if you adopt a trading strategy with a 3:1 or even 2:1 risk-reward ratio you can be right just ⅓ of the time and still be very profitable.
In simple words, it’s ridiculous to adopt a trading strategy that requires you to risk the same amount that you expect to gain on every trade.
Many successful traders use a 3:1 risk-reward ratio because they know that they won’t be right all the time, so they want the winning trades to be larger than the losing trades.
Using The Risk-Reward Ratio
The best way to know where to exit a position is before you get in. It’s paramount to determine where to set the stop loss before you buy a stock. That is because if the stock price drops there will not be any hesitation, the decision has already been made and there won’t be any second-guessing.
“Not defining and committing to a predetermined level of risk cost traders and investors more money than any other mistake”.
Once the stop order is set then you can go ahead and set your profit target price. If for example, you buy DIDI stock at $10 and you are not willing to risk more than 8% of the position, you set your stop loss at $9.2. With a risk-reward ratio of 3:1, your target price for selling the stock will have to be at $12.4, for a 24% profit. With this strategy, you are risking $0.8 to make $2.4 for every DIDI share that you decided to buy. With TradingView you can use the Long Position tool to visualize the risk-reward ratio on the chart.
Swing Trading Example
So, you just set your risk tolerance and your expected reward. Now you must act on it. One way to play this trade is to just follow the strategy exactly as it is and sell on either price target touches first.
But, let’s say that after a few days of opening the position the price goes up to $11.60, that’s up by 16% and equal to a 2:1 risk-reward ratio from your stop, right? This is a very good time to protect your invested capital, as now you can go and set your stop loss at breakeven. This means putting your stop-loss order at $10, the same price that you bought the stock.
Using Risk-Reward ratio to Calculate Position Size
Position sizing refers to the number of units invested in a particular security by an investor or trader.
Normally the risk on a single trade should never exceed 1% or 3% of the total portfolio size. Thus, at 1% for a trading account of $5,000, the maximum risk per trade has to be $50.
With a trading account of that size, you see a cup and handle pattern forming in Bitcoin.
The buy point is the breakout from the handle and the stop loss should be established at least at the low of the handle.
Lets say the breakout price is $52,000 (buy point) and the low of the handle is at $48,000 (stop loss), which is a 7.70%.
As you can only risk $50 per trade, you buy 0.0125 Bitcoin because when setting your stop with a 7.70% risk, you only risk $50.
BTC 52,000 / 0.0125 = $650
$650 * 0.077 = $50.05
Being a live trader is not an easy job, much less an easy hobby. It doesn’t matter if you are a day trader, swing trader, or a long-term investor. Also, it doesn’t matter if you trade stocks, crypto, forex, options or futures. The real key to success in trading is longevity, and that longevity is achieved with risk management. Good luck in your trading!


