TradingView is a popular online platform for charting and trading various financial markets. It was founded in 2011 by a team of traders and software developers who wanted to create a tool that would be easy to use and offer advanced functionality. We think Trading View is worth its weight in gold, and in this article we will explain why its used by over 30 million people worldwide.
While trading view can be used for free (with delayed market data), we will also explain how you can save up to 50% on this platform with real time data and all paid features as a referral from your friends at Livestream Trading!
TradingView offers a wide range of features and tools to help analyze and trade financial markets. Below we will outline the many features and benefits that TradingView has to offer:
TradingView Charting tools
TradingView offers a variety of chart types, including candlestick, bar, and line charts, and provides customizable options for charting elements such as timeframes, indicators, and drawing tools.
You can use virtually any time frame you can imagine, from second charts to yearly charts. TradingView has the most robust charting capabilities that we've ever seen.
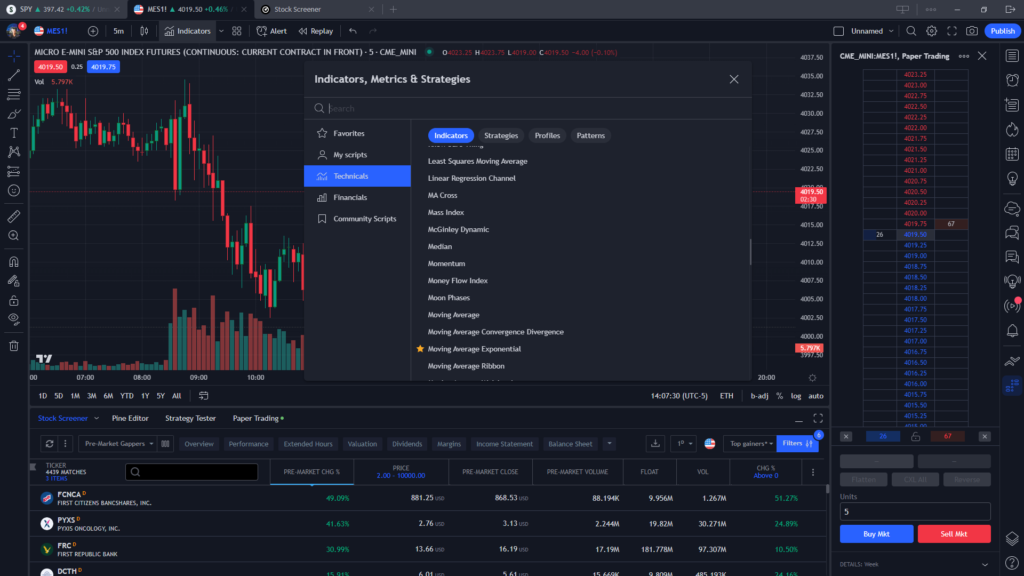
Indicators
While the free version of Trading View only allows 3 indicators per chart, the paid verison offers hundreds if technical indicators that traders can use to analyze the markets, including moving averages, oscillators, volume indicators, AVWAP, and more.
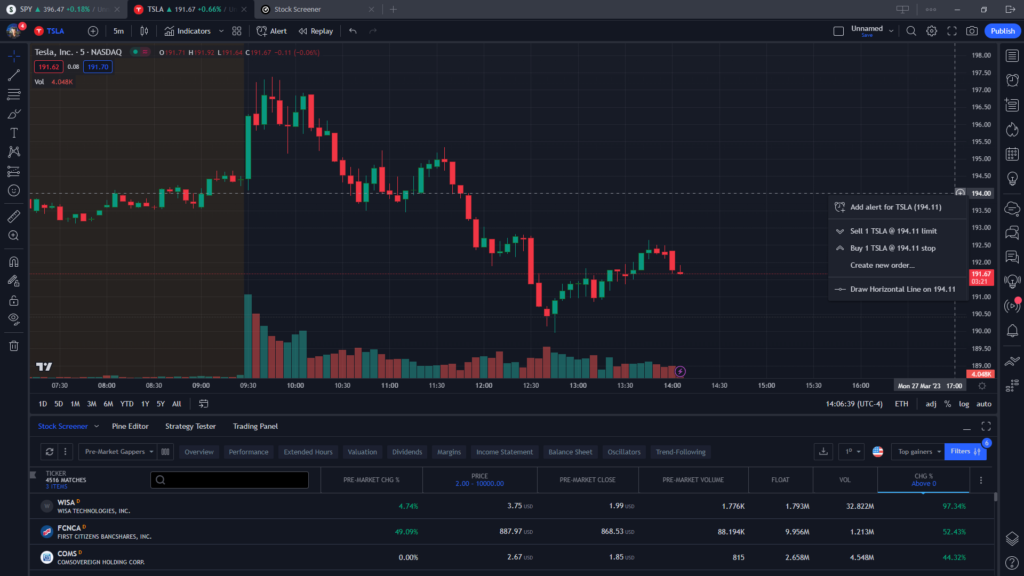
Customizable Alerts
As with many charting platforms that we have reviewed, we love the ability to quickly and easily add price alerts to charts so we can be notified when they reach specific levels that could trigger a trade. It is so easy to add an alerts to Trading Views charts: simply click the "+" icon next to the price, and add an alert that can notify you via the platform, text message, or email when the price you are tracking has been reached.
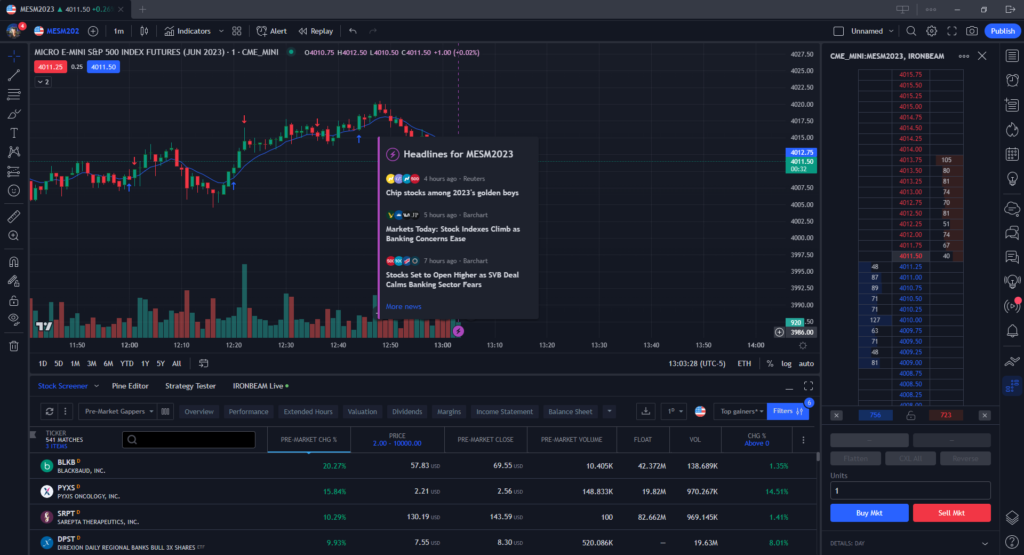
News Events on Charts
One of the most interesting features of this platform is the ability to display news events and fundamental data right on the charts.
This can be very helpful if you are trading futures, for example, and want to be notified when there is a Fed meeting or any event that could move the stock or asset that you are trading.
(insert picture)
Market data
TradingView offers real-time market data for a wide range of financial instruments, including stocks, cryptocurrencies, forex, and futures.
Other charting programs we have reviewed such as TC2000 don't offer data for futures, cyrptocurrency or forex, which is why Tradingview may be the better choice between the two depending on your needs.
Backtesting
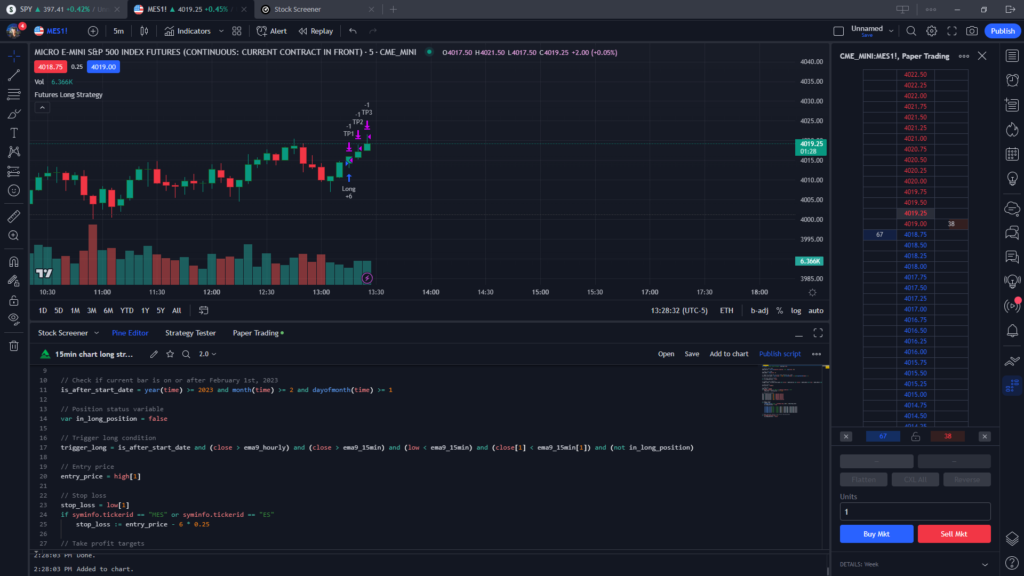
TradingView provides a back-testing feature that allows traders to test their strategies using historical market data. In order to backtest a strategy, you have to code it in their pine editor. There are various resources on how to do this online.
If you are planning to backtest a strategy, this is a great way to do it to see how it performs in historical market conditions before trading live. In the image below you can see a simple pinescript triggered a trade that automatically entered and took profit targets based no parameters I set in the pine script editor on this paper trading account for back-testing:
Trading View Scanners
No charting platform is complete without access to scanners to help find plays in the market. TradingView offers a powerful market scanner tool that allows traders to quickly and easily scan the markets for trading opportunities based on specific and customizable criteria.
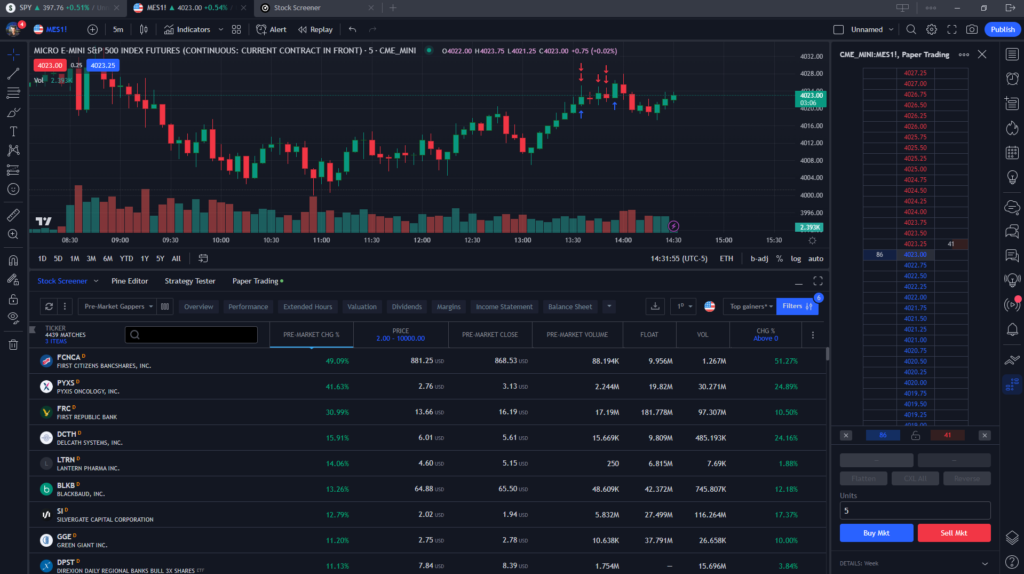
Traders can set specific criteria to filter stocks or other financial instruments based on indicators, price movements, and other factors. For example, traders can use the scanner to find stocks that are trading above their 50-day moving average, or that have just broken out of a chart pattern.
TradingView's market scanner operates in real-time (for paid users), so traders can see the latest market data and trading opportunities as they emerge. You can set alerts based on the results of the market scanner, so they can be notified when a stock meets their specific criteria.
TradingView's market scanner includes a back-testing feature that allows people to test their criteria on historical data to see how well their strategies would have performed in the past.
The market scanner also includes advanced filtering options, such as the ability to exclude certain stocks or industries from the results, or to sort the results based on specific criteria.
Overall, TradingView's market scanner is a powerful tool that can save traders a lot of time and help them identify potential trading opportunities more efficiently. The scanner's customizable criteria, real-time scanning, and backtesting features can all be used to develop and refine trading strategies.
Paper Trading
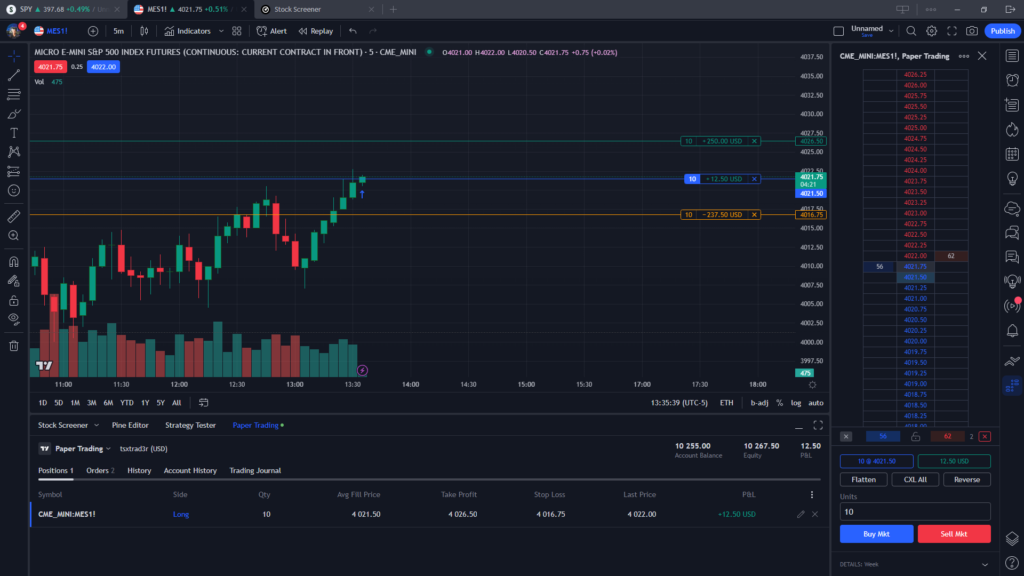
Paper trading might be the best free feature this platform has to offer if you are looking to test some strategies, run some back-tests, or simply simulate live trading.
The free version of Tradingview does have a 15 minute delay in data, so if you want to trade real time market data, you would need to upgrade to a paid plan, but for the purpose of practice trading, the delayed data is great for this.
Live Trading with Tradingview
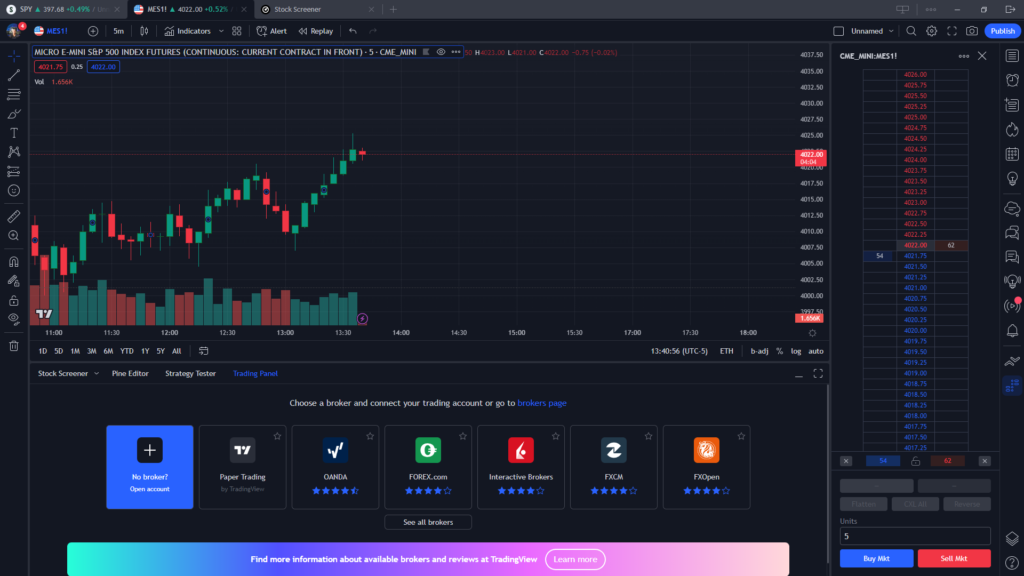
You can trade live via a selection of many brokers using Tradingview as your platform. Simply connect to a broker via the list provided when clicking the "trading panel" tab and you can be live trading with Trading View.
Many brokers including our preferred futures broker, Ironbeam, allow connections through TradingView making it a popular choice amongst futures and cryptocurrency traders, as well as stock traders with the option to connect via Interactive Brokers.
Trading Directly on the Charts
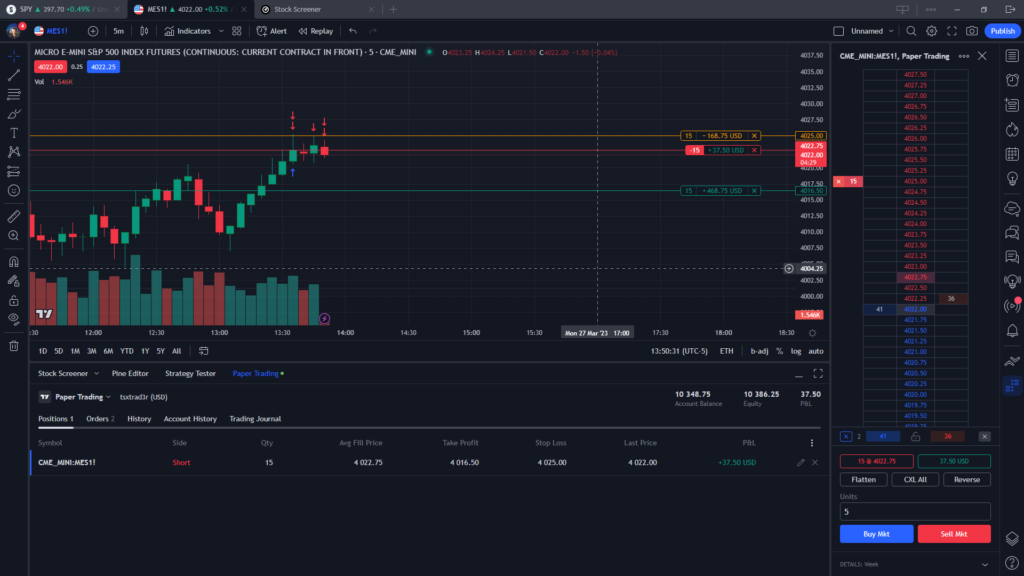
With both paper trading and live trading you can trade directly from the charts on Tradingview.
This means you can enter, exit, and manage positions simply by clicking and dragging orders on the chart which makes it extremely user friendly, even for the beginner trader.
One feature we love is how it shows the profit and loss on your stop loss vs take profit orders, which can easily be dragged around and adjusted to your liking during live or simulated trading.
In the example below, the yellow line indicates the stop loss level (and dollar risk if that level is reached), the green line represents the profit target, and the red line indicates the position average price (in this case, a short position):
Tradingview Free vs Paid Platform
TradingView offers both free and paid plans, with different levels of functionality and benefits. Here are some of the limitations and differences between TradingView's free and paid platform:
Data access: TradingView's free plan provides access to delayed data, while the paid plans provide access to real-time data for a variety of financial instruments.
Charting tools: The free plan provides access to basic charting tools, while the paid plans offer more advanced charting features, such as more technical indicators, drawing tools, and customizable alerts.
Indicators and strategies: The free plan provides access to a limited number of technical indicators and strategies, while the paid plans offer a wider range of options.
Customer support: Paid plans come with priority customer support, while free plan users may have to wait longer for support.
Ad-free experience: Paid plans offer an ad-free experience, while free plans include ads.
More charting data: The paid plans offer more historical data for charting, enabling users to analyze trends over a longer period.
Customizable alert criteria: The paid plans allow users to set more complex criteria for customizable alerts, such as combining multiple indicators or setting conditions based on volume.
TradingView Paid Plans vs Free Plan
Free plan: TradingView's free plan offers basic functionality, including access to delayed data, limited charting tools, and a limited number of technical indicators and drawing tools.
Pro plan: TradingView's Pro plan is geared towards individual traders and investors. It offers real-time data, advanced charting tools, over 100 technical indicators and drawing tools, and customizable alerts. The Pro plan costs $14.95 per month, or $155.40 per year if paid annually.
Pro+ plan: TradingView's Pro+ plan is aimed at more active traders who need more advanced features. It includes everything in the Pro plan, as well as more data and indicator options, and the ability to use multiple charts and layouts. The Pro+ plan costs $29.95 per month, or $299.40 per year if paid annually.
Premium plan: TradingView's Premium plan is designed for professional traders and institutions. It includes everything in the Pro+ plan, as well as custom trading indicators and strategies, unlimited access to historical data, and priority customer support. The Premium plan costs $59.95 per month, or $599.40 per year if paid annually.
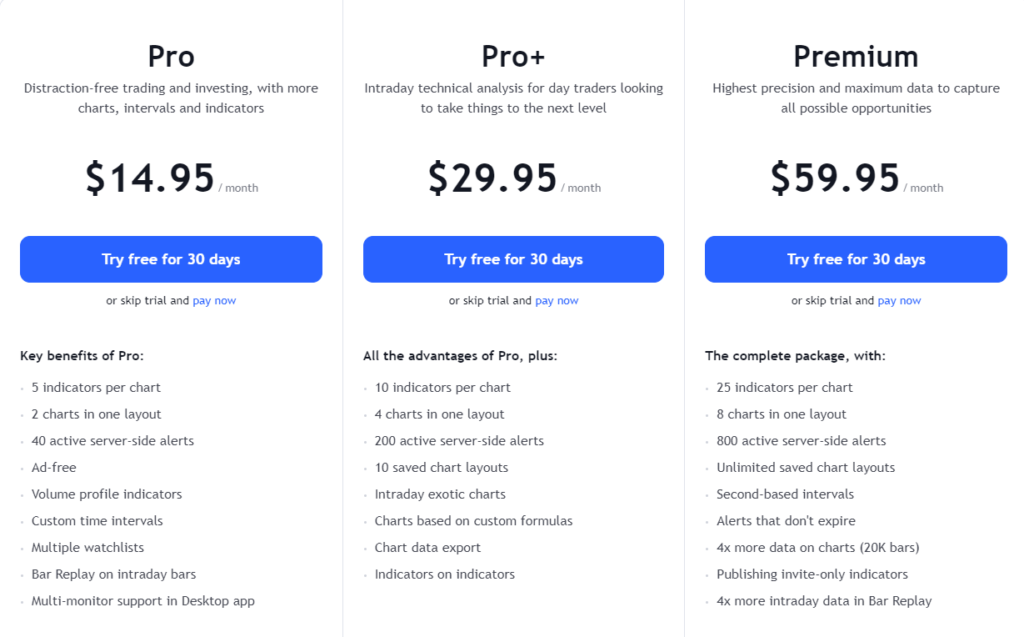
Overall, the paid plans offer more advanced features and benefits compared to the free plan. However, the free plan can still be a useful tool for traders who are just getting started or who have limited trading needs.
These are just some of the many features that TradingView offers, making it a powerful tool for traders and investors alike.
Whether you are live trading, simulation trading. or just want a more robust charting platform, Tradingview gets 5 stars in our books and we are happy to offer you a 30% discount if you decide to upgrade from a free to a paid version of this platform, simply click this link to get started with the free platform.

