Introduction and Background
There are many indicators people could use in trading. Some based upon news such as the latest press release, technical like price action, or even fundamentals like the balance sheet.
The Relative Strength Index is a form of a technically based indicator that has served traders/investors since its inception in 1978.
It was originally spurred by J. Welles wilder Jr. in his trading book “New Concepts in Technical Trading Systems” and has been a corner stone for many traders across various markets ever since.
The Relative Strength Index is a graphed line that oscillates between 0 to 100. The most basic use of the RSI stems from its trend reversal/pullback signals. When the RSI is above 70, investors/traders deem the asset overbought (over extended to the upside) and thus builds the bearish thesis that a short trade would be best as the asset should see a correction.
Conversely, when the RSI displays anything below 30 it is seen as bullish. A below 30 reading means that the indicator finds the price action oversold (over extended to the downside) and is due for a correction to the upside, fueling the bull thesis for a buy.
Calculation of RSI
Calculation 1 = 100 – (100/ (1 + (Avg. gain over last 14 days/Avg. loss over last 14 days)))
Calculation 2 = 100 – (100/ (1+ (Previous avg. gain*13 + Current gain/ Avg. loss *13 + Current
loss)))
Using these two formulas the RSI is formed in an oscillating fashion. Like all technical indicators they are lagging to price action because they are formed taking in price action after the fact.
The most common form of RSI is based on the last 14-days of price action and update daily with newest addition of data coming in.
Although, one could use this indicator on any time frame, from 1-minute to weekly charts, but the number of data points taken in would vary as you’d expect depending on the chosen time frame.
RSI Divergence: A Common Trading System
A very common use of the RSI in a trading system is the RSI Divergence. There are two types of divergences, bullish and bearish.
A bullish RSI divergence is when the price action is falling, but the RSI is actually creating a higher low from the “oversold” (below 30) region. This is a bullish signal to buy the asset to many traders/investors.
Ex. $MIRM bullish divergence
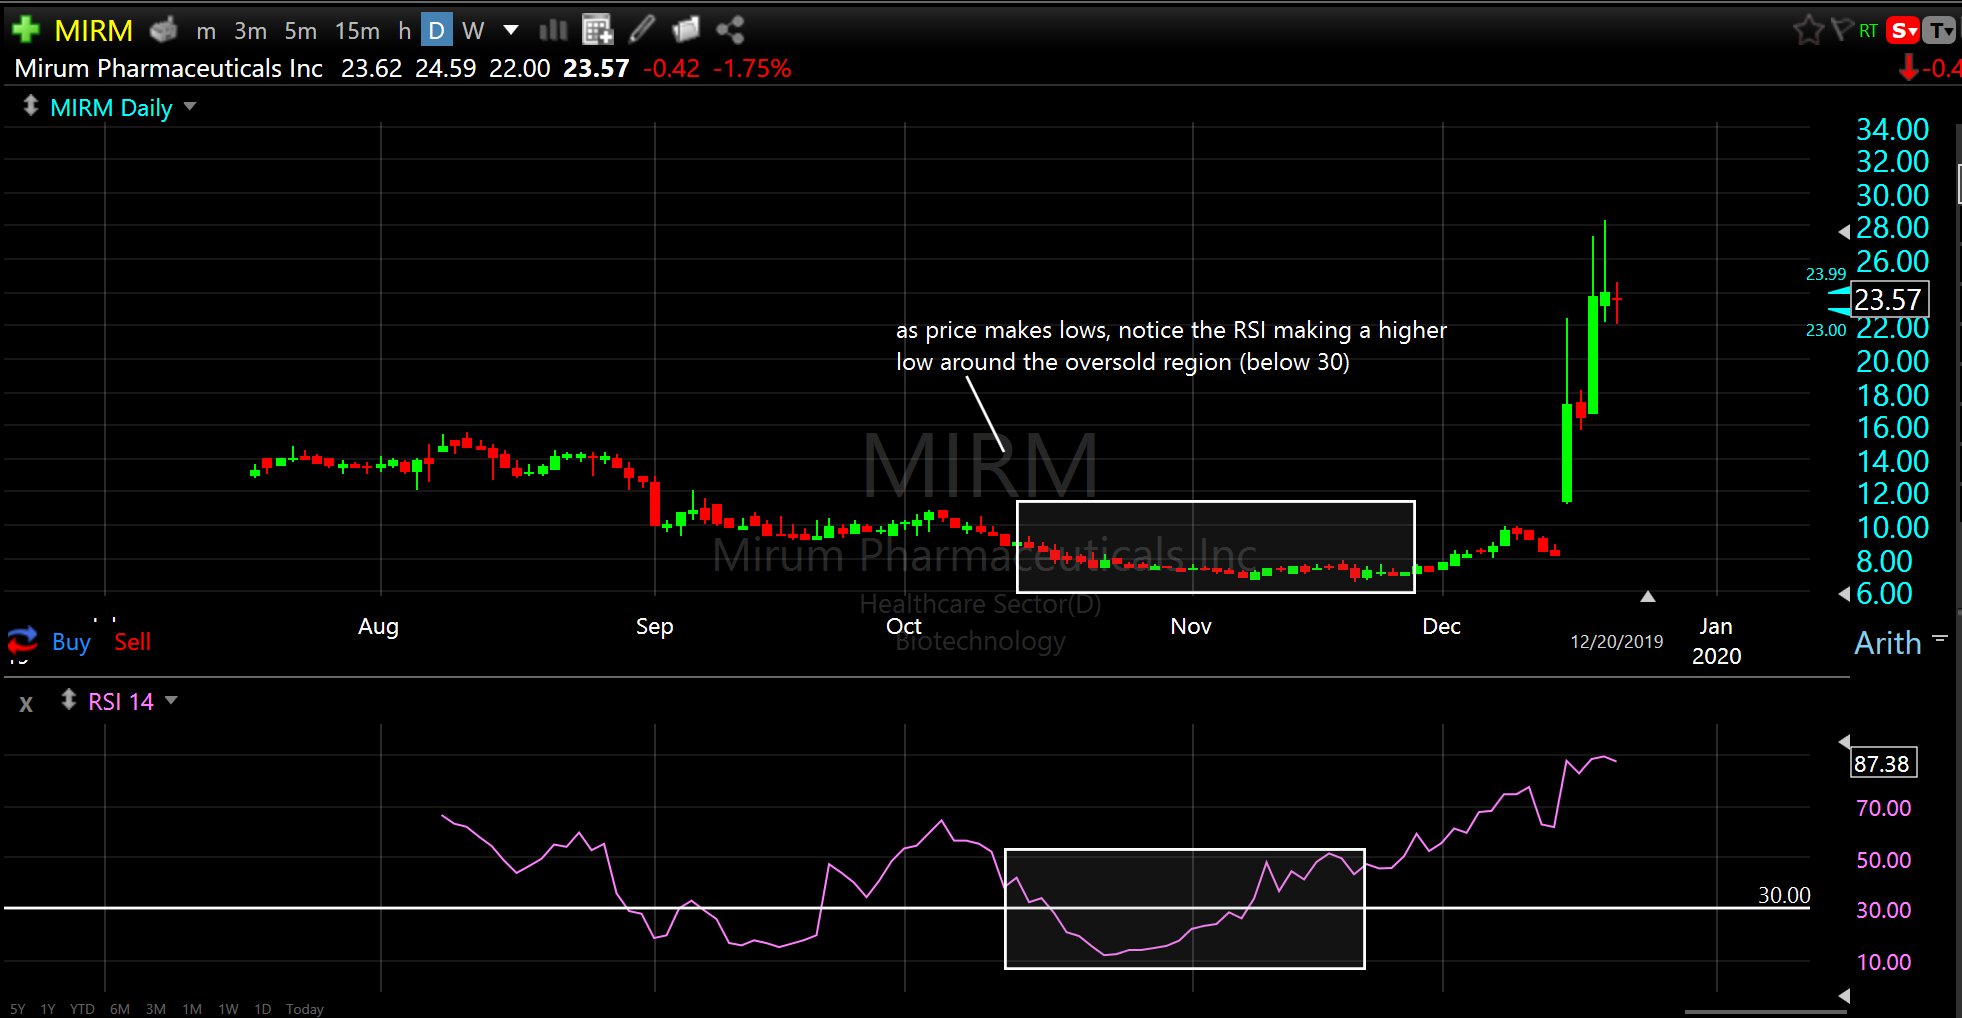
MIRM Bullish Divergence
Opposite of this is the bearish divergence, which occurs as the price goes higher but the RSI forms a lower high in the “overbought” (above 70) region. This is a signal for some traders to
initiate a short position in expectation that a reversal is coming.
Ex. $TSLA bearish divergence
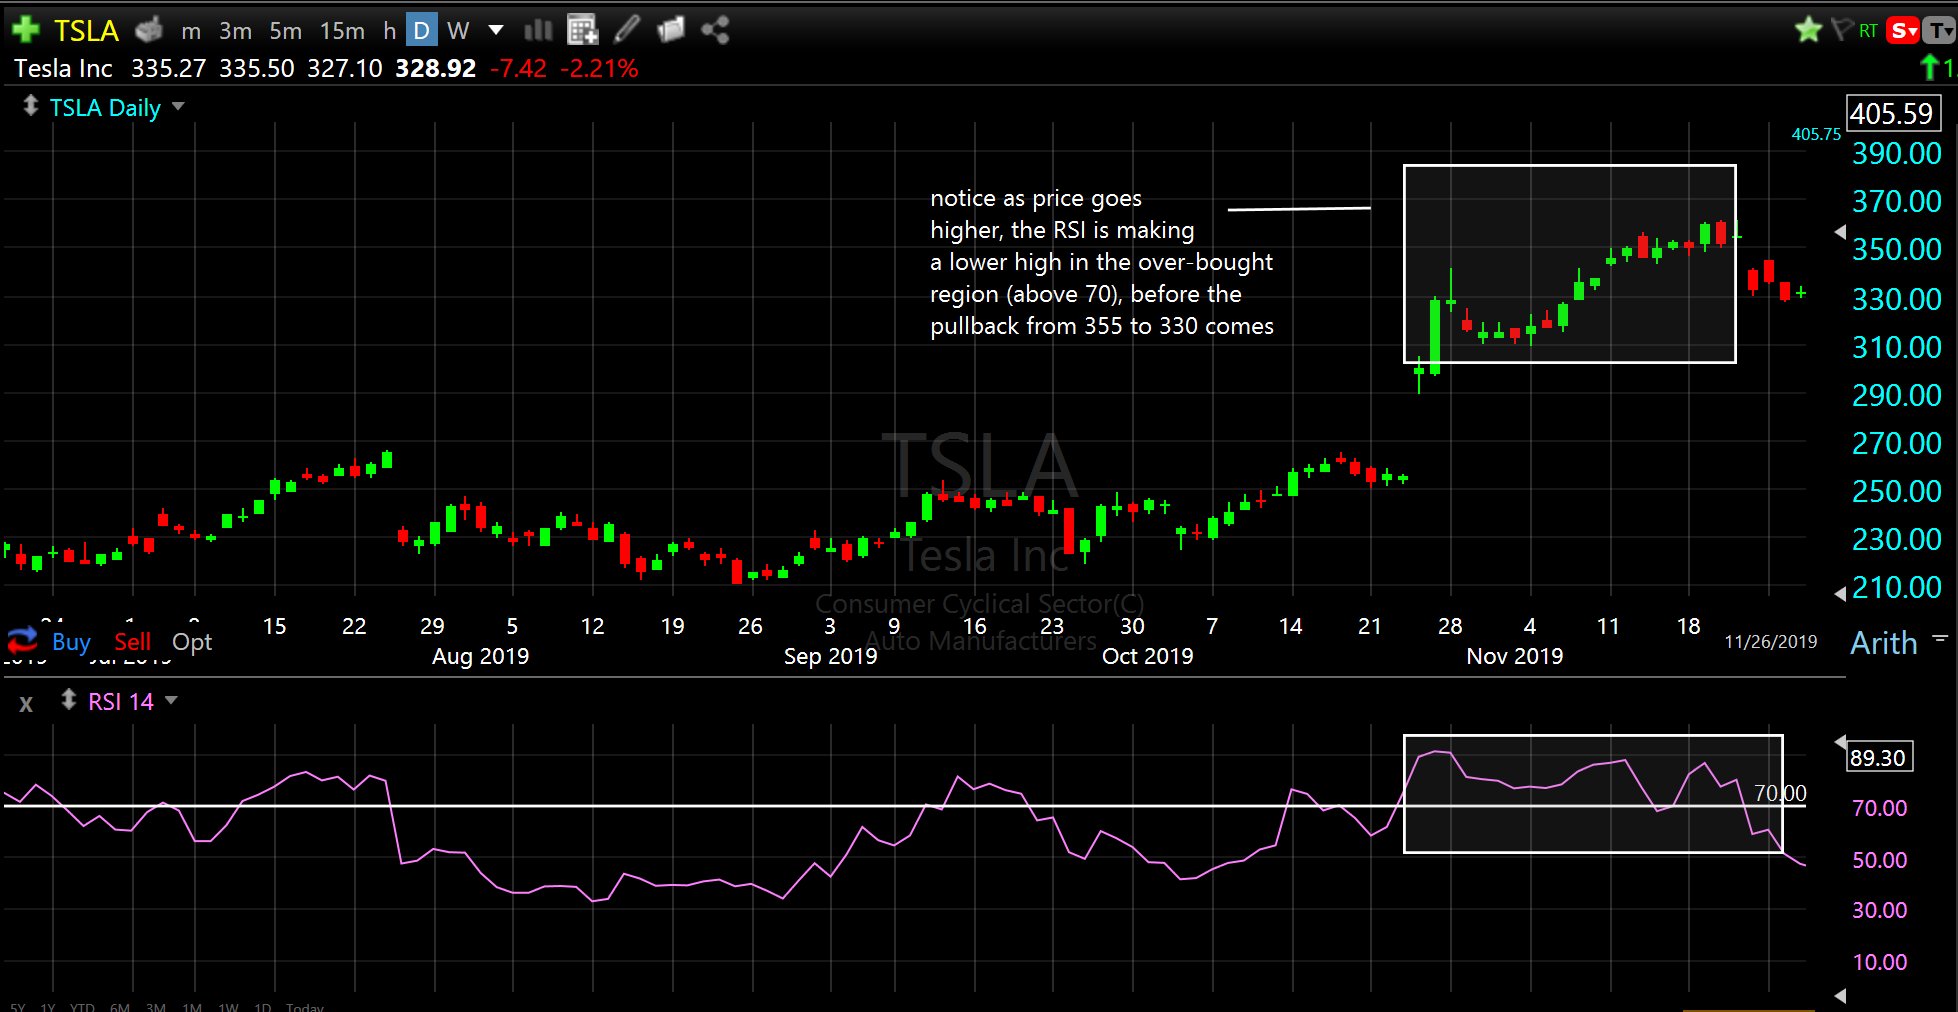
TSLA Bearish Divergence
Conclusion: Variety and Variability
There are infinite indicators out there, and infinite ways of using each indicator, so who is to say how one should use them or not.
For some, price action will be the only thing of value, to others 15 indicators will provide clarity.
Like everything else in trading, there is no one size fits all. It is important to back test the validity of indicators (even if the only one you use is price) to see what value you can extract from it, if any.
At Livestream Trading we keep our trading system simple and robust. Predominantly focusing on price action, the overall picture taking place, as well as a few indicators we use very uniquely to have our trading system operate as one big machine with all its parts in unison.
If you’re interested in how we use indicators and conjoin them to price action to have system that produces an 80%+ win rate, then check us out here.
Till next time traders, keep learning, stay safe, and happy trading!

Learn How To DayTrade Stocks
Grab our Free Day Trading Video Lessons Below and Learn Today's Best Trading Systems!