The markets behave according to near, intermediate and long-term trends. And, the difficulty of profiting using technical analysis is not with the rules but with their interpretation. To smooth the process and help the visualization of trends we can use the moving average method.
What is a Moving Average?
A moving average is a constant average that is calculated for each successive chart period interval. The result is plotted on a price chart showing a smooth line representing the successive average price creating a moving average chart.
What is a Moving Average Chart?
A moving average chart translates as the use of moving averages to tone down the erratic data that comes from daily price fluctuations. The goal is to make it easier to see the underlying trend. You can also say that it calculates the mean of the data given, that’s why you can use the moving average method in every market.
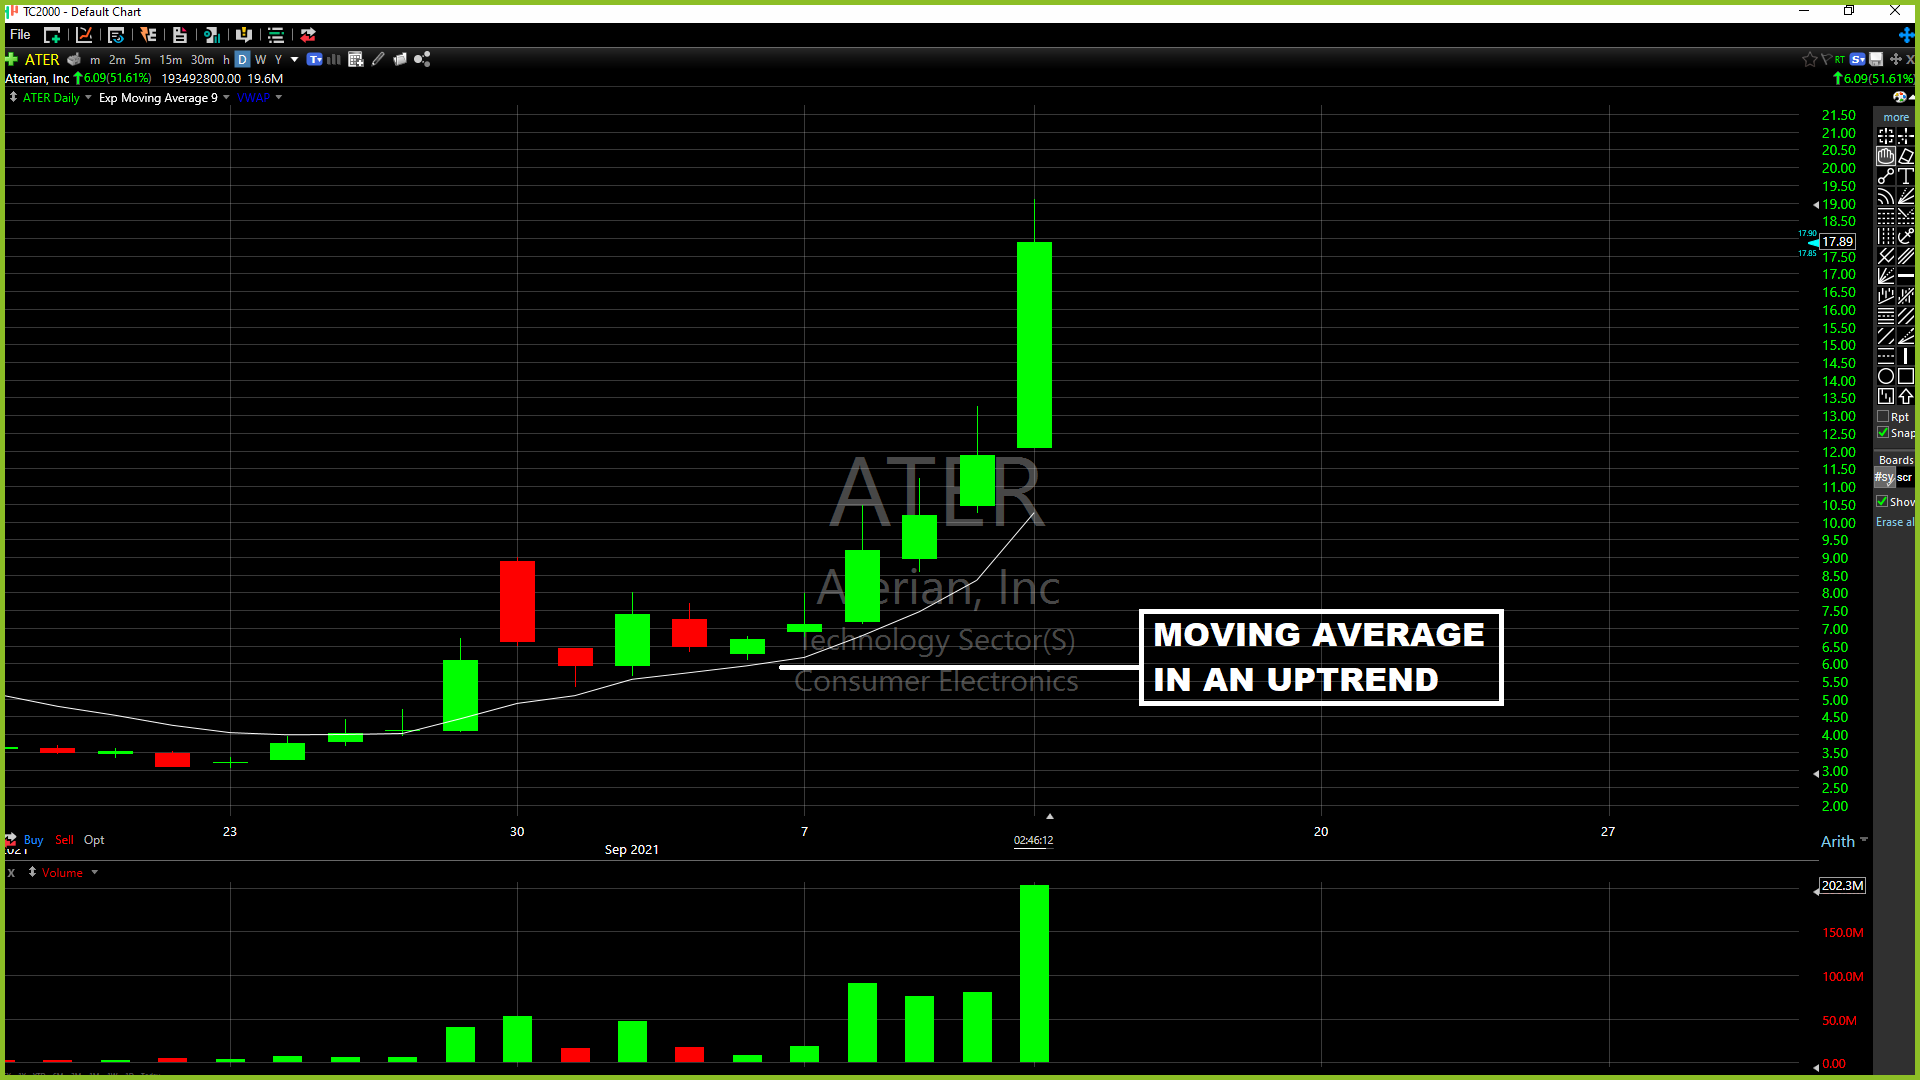
Moving Average Chart Uptrend
You can use a moving average chart for stocks, cryptocurrencies, forex and more.
Understanding Moving Averages
Moving averages have been tested by academics and shown to have statistical significance. Many of the most successful technical investment managers use moving averages for stocks to determine when trends are changing direction so that they can ride the next trend as soon as possible.
A moving average is just one number that represents a net of certain past numbers. For example, a 10-day moving average, or a 10d MA, is one number that represents all the prices for the past 10 days. It filters out each one of the prices during the period in question indicating the behavior of the price group.
Moving averages of stocks or cryptos, are based on closing prices, but they can be calculated on opens, highs, lows, daily means and any other value that the price fluctuation can give. As long as the price data chosen is consistent throughout the calculations of the whole moving average.
Normally, all the finance software providers like TradingView, TrendSpider and Optuma, use the closing prices as default.

Learn How To Day Trade Stocks
What is The Use of Moving Average Charts?
The most commonly used type of moving average is the Simple Moving Average or SMA. Sometimes it is referred to as an arithmetic moving average.
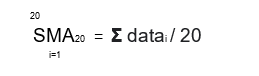
The SMA is made by adding a set of data and then dividing by the number of observations in the examined period. A simple moving average example is summing the closing price of the last 20 days and then dividing the result by 20. That will give us the mean price for the 20-day period.
The simple moving average formula for a 20-day period is:
Once calculated, the moving average is plotted on the price chart. The next image will show the chart of Pfizer stock price from January of 2018 to April of 2019 with a 20-day SMA. You will see that the daily price fluctuations are smoothed by the moving average so that the analyst can spot the underlying trend without any distraction.
See that from January to July of 2018 the price made hard swings from $37 to $31 while the 20d SMA kept it’s movement between $35 and $33, smoothing the price data.The moving average is giving the sign that the price is going sideways.
Then, at the end of July the Pfizer stock price began its ascend until it peaked in October. You can see how the price didn’t rise in a straight line, it fluctuated. But, the SMA did go up in a straight line. So, at the beginning of the movement, you see a rising price and is accompanied by its 20-day SMA. When this happens, the SMA is confirming an upward trend by following the price changes in Pfizer’s stock price.
After the stock price peaked in October, it began its descent in December, and the SMA confirmed the movement by going down with the price.
With this moving average example, it is safe to say that a rising moving average indicates an upward trend and a falling moving average indicates a downward trend. But it is a lagging indicator. By definition a moving average is an indicator based on past prices. Using moving averages will always give us some delay in signaling a change in trend. So, the moving average is normally used to confirm the trend, not to anticipate the trend.
How To Use a Moving Average Chart?
As you may wonder, because moving averages can be calculated for various lengths of time, which length is best to use?
A longer time period uses more data; therefore, each day’s data becomes less important in the calculations. As a result, a large change in a stock or crypto price doesn’t have a large impact on the longer moving average. This can be an advantage and a disadvantage. That’s why traders use multiple moving averages simultaneously and make a moving average control chart.
Here is another moving average example. If we plot a 10-day SMA with a 50-day SMA in the same Pfizer price chart. You will see how the shorter time period SMA fluctuates nearer to the price. While the 50-day SMA is slower and further than the price. If you see closely when the shorter term SMA makes a bottom up crossover of the longer term SMA, it signals what could be the beginning of a new uptrend of the stock price. Is very common to use this signal as a buy signal (green circle), and whenever the shorter declines below the longer is considered a sell signal (red circle).
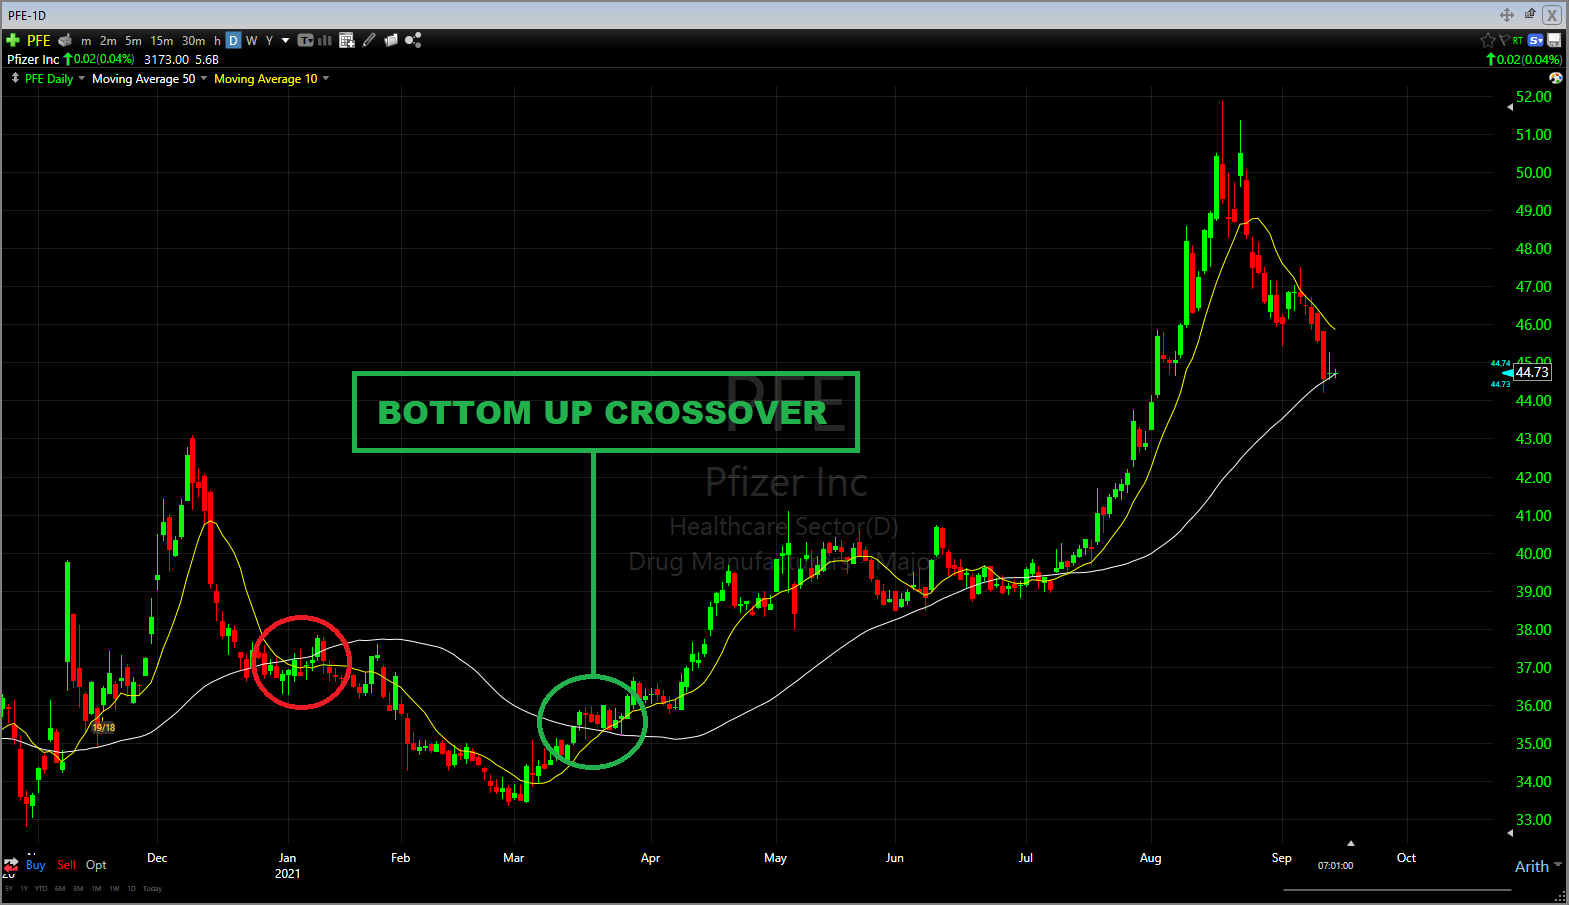
To add to this strategy, the crossover zones can be used as support and resistance zones. Note in the image that the zone where the 10-day SMA crossed below the 50-day SMA is a new resistance zone that the price tried to break but couldn’t.
Using this moving average method while prices are moving sideways can result in several whipsaws. It’s very difficult to actually determine the beginning of a new trend in this zone because the shorter-term moving average will oscillate back and forth from the longer-term moving average. That’s why in some instances, moving averages are used just to determine trends, and then chart patterns are used as entry and exit signals. This reinforces the idea that the trader must be sure that the trend exists before using moving average crossovers for signals.
Traders use moving averages to determine trend, levels of support and resistance, spot price extremes and for specific trading signals.
- To determine trend. Many investors compare the price vs the 200-day moving average. If the stock price is above the 200-day moving average, the stock is considered in an uptrend. Conversely, if the stock price is below the 200-day moving average, the trend is considered downward. The hypothesis is that when the price is above its 200-day moving average, the price should trend upward for at least a year.
Every moving average determines the trend regarding its time horizon
| 5-day MA | 1 week |
| 10-day MA | 2 weeks |
| 50-day MA | 3 months |
| 100-day MA | 6 months |
| 200-day MA | 1 year |
- To determine support and resistance, because as you saw in the previous moving average example, the crossover zones can be future support and resistance zones. In addition, prices seem to halt at the vicinity of moving averages. In trading, when these halts happen are called throwbacks and pullbacks. They can happen to test a previous support or resistance and also to test the strength of the trend by rebounding or crossing over the moving average line.
- To determine price extremes. As moving averages are the mean of a certain data, any reversion of the mean will tend to go back to the moving average. Sometimes these movements can be profitable because when price goes substantially away from the trend, it is often a signal that the trend is likely to change direction and go back to the moving average line.
For day traders, that uses shorter periods of bar or candle charts. The moving averages used should be different, right?
For a daily candle chart, we use the 50-day and 200-day moving averages because they determine the trend for 6 months and 12 months respectively. So, the best moving averages for a 15 minutes candle chart would be the 16-bar and the 32-bar moving averages.
The trading day has 8 hours of open trading, and each bar accounts for every 15 minutes of trading. Every 16 bars accounts for 4 hours of trading and every 32 bars accounts for 8 hours of trading.
That is one way, but is not the perfect way. Every trader must test every variation and choose from the variations he or she feels more comfortable with.
What Other Types of Moving Averages Exist?
There are several types of moving averages available. Weighted, simple (SMA) and exponential (EMA), to name a few.
Exponential Moving Average
One of the most popular is the Exponential Moving Average or EMA. It was created because sometimes when the earliest price movement shows a considerable change the Simple Moving Average won’t change as much as some analysts would prefer. That’s why the Exponential Moving Average was created to give more weight to the most recent data so that these types of price fluctuations have more effect on the moving average control chart.
The Exponential Moving Average formula is as follows:
- To determine the weight:
WEIGHTcurrent = 2 / (number of days in MA +1)
- To calculate the EMA:
EMAday i = WEIGHTcurrent x DATAday i + WEIGHTma + MAday i-1
Because of this method the EMA is also called the Exponential Weighted Moving Average. These moving average calculations helped give birth to the Moving Average Convergence Divergence or MACD.
Another type is the Geometric Moving Average or GMA, which uses percentages rather than prices itself. It is more commonly used when analysing indexes like the Dow Jones 30.
And, the Triangular Moving Average or TMA. It is simply the moving average of another moving average. This gives a doubly smoothed moving average and it better represents the underlying trend. The bad thing is that it lags too much from the price movements.
What are the Advantages of a Moving Average Chart?
The very basic of trading is to identify a trend and ride it till its very end to make profits. At times, daily price fluctuations makes the trader have a hard time to determine the real underlying trend. Moving averages are tools that help smooth the data, helping the eye to see the true behavior of the price.
Using a moving average control chart can improve your understanding of the trend because, when two or three moving averages are doing the same (going up, or going down), each one is confirming the other.
There are several moving average methods that can be used and tested for future trading. You just have to try some variations and find what works for you.
What are the Limitations of a Moving Average Chart?
A trader can never be too dependent on an indicator. The moving averages are no exception. Because moving averages are based on historical prices, they are a lagging indicator. The shorter the period covered by the moving average, the less lag will have, but will give more false signals. Also, if the security chosen for analysis does not have the tendency to trend, then moving averages are useless.
While we do use a specific moving average line with our trading system, there are other pieces of criteria that we use to validate trade signals which you can learn about from our free (for members) Systematic Trading Course.
[mashshare]

FREE Trading MasterClass