I could not have picked a better time to send out that free video lesson on multi-time frame breakout patterns to our mailing list yesterday, because today the exact same chart pattern triggered on AUPH and it was a massive runner.
In case you have missed the video lesson, please sign up as a free subscriber and it will be emailed to you right away.
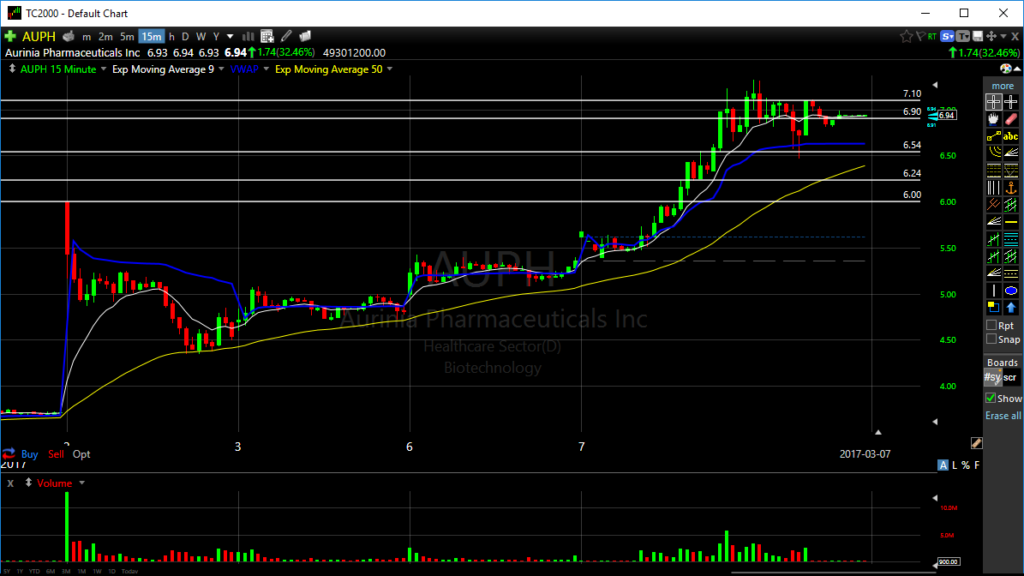
Now that you are caught up on the chart pattern and criteria, here is the chart from today on AUPH:
Planning the trade
The above chart is a 15 minute time frame chart that represents the action from the past 4 trading days. (In fact, that first red candle is where we shorted it at $5.90 last Thrusday for a big win) but today the setup was on the long side, for a multi-time frame breakout to all time highs!
You'll notice that 15 minute chart has formed a really nice cup pattern under $6.00, and if you flip to your daily chart, you'll see that $6.00 is the all time high for this stock.
So what we have, as outlined in the free video lesson from yesterday, is a multi-time frame breakout pattern.
Let me show you the 1 minute intra-day chart below, and I'll explain my thought process as I plan and execute a trade like this.
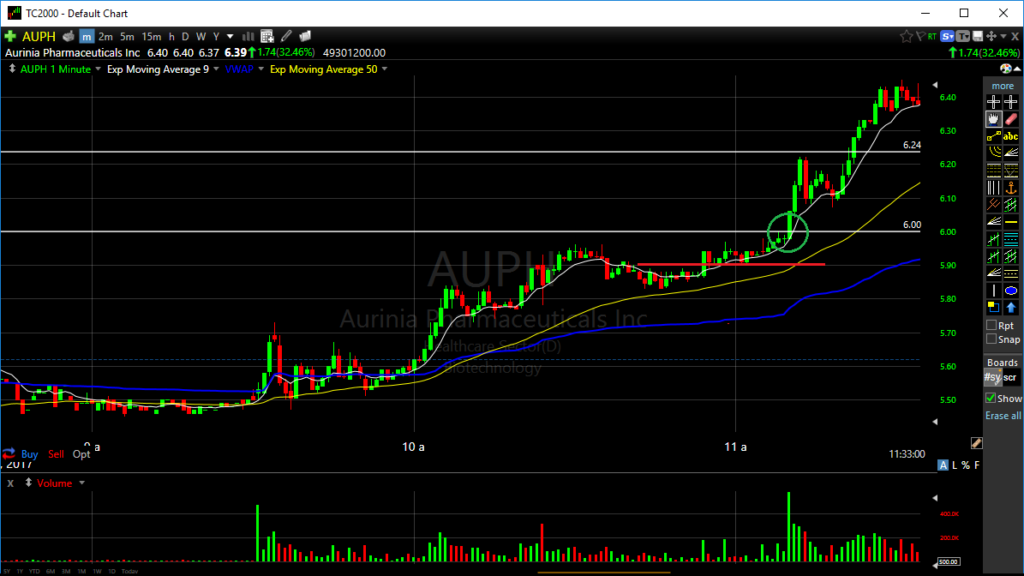
AUPH 1 Min Chart
The chart above is just today's action. You can see that familiar pattern from the video lesson forming on the 1 minute, 5 minute, 15 minute, AND daily chart all at once (hense, multi-time frame breakout)
However, if you look at the intra-day chart above you will see another cup and handle pattern forming just under $6.00 on that 1 minute chart with a nice base at $5.90 (as indicated by the red line - that will represent our stop loss point)
The beautiful thing about this setup, is that we have a nice base at $5.90 which gives us a clear risk profile on the trade.
One thing I always make sure is that our traders understand the trade plan before the trade, including the stops, targets, and entries, as well as suggested exit points.
Examples of multi-time frame breakouts trading
An example of how to plan this trade would be to use that base at $5.90 as your stop loss point, and buy anywhere between $5.91 - $6.00, which puts you in a position for a huge gain with very minimal downside risk.
For example, if you bought a mere 1000 shares at $5.98 with a stop loss at $5.89, you would be risking 9 cents per share on the trade, with huge upside potential given that this stock was breaking out into all-time highs.
So, if you bought 1000 shares at $5.98, your risk on the trade would be $90 (if you were to stop out at $5.89), and the maximum reward could have been up to $1,330 if you had sold at the high of day which was $7.31 (which isn't typical, of course) - but just to illustrate the point, in these scenarios the reward far outweighs the risk.
Risks management in multi-time frame breakouts trading
Its not every day you get an A+ multi-time frame breakout pattern like this, but when you see it, and everything is lined up properly (with a low risk entry and proper trade plan, as described above), this can be a very profitable pattern with very little downside risk.
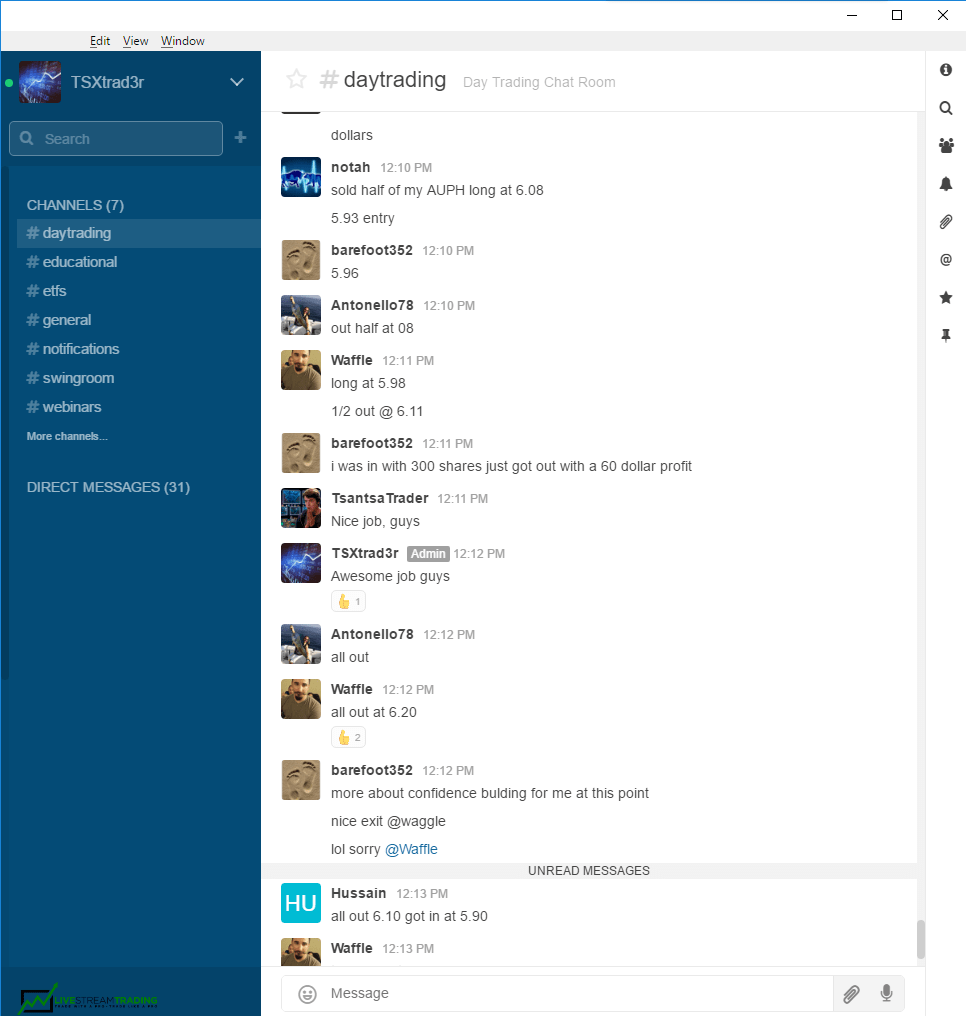
If you did not notice this setup today, then you are really missing out by not being in a community with other traders working together to identify and execute trades based on high probability patterns like this. The more eyes we have on the market, the better, and we are all looking for the same great patterns to trade.
In fact, a bunch of our students traded this pattern and banked on it in a matter of minutes, some holding it out longer than others, but the point is, we all saw this pattern well enough ahead of time that we could take part in the action.
Take lessons from a professional trader
Also, because a trade this perfect doesn't come across every day, be sure to watch our other 7 video lessons on my main trade patterns for 2017 which will explain the other setups I use on a daily basis, and of course, you can always follow my live trades via our screen share and chat room.
We have a group of traders all working together to identify opportunities like this so we can all profit together, as a team.
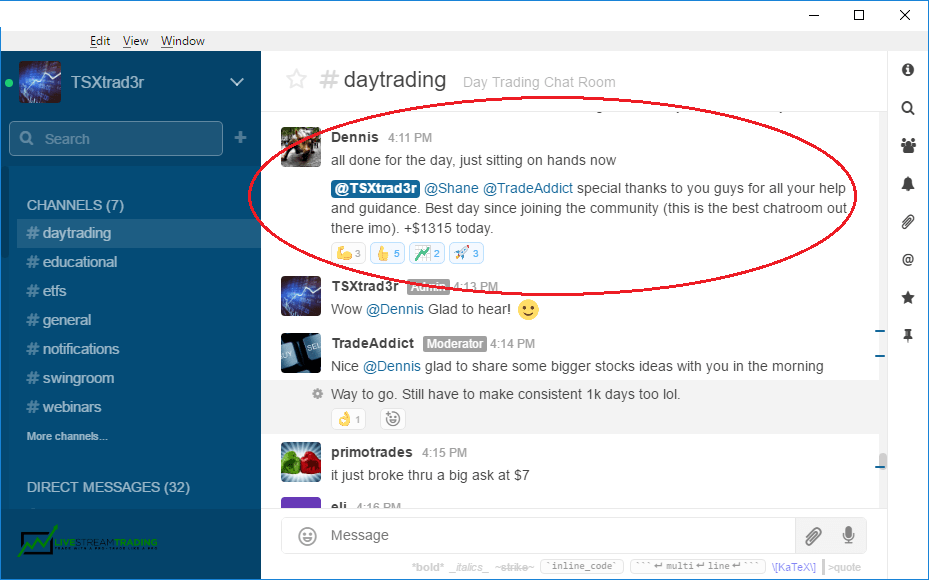
In fact, one of our newer traders who has been with us for less than a month now, had his best day ever with us today!
The conclusion
I hope you found this blog post helpful in understanding the basics of identifying and executing a multi-time frame breakout trade.
Please share this content on social if you enjoyed it!
[mashshare]
Have a great night folks.
See you tomorrow on the LiveStream.
Yours truly,
Jeff aka @TSXtrad3r
P.S. - Grab our free Webinar Video on tips for account building and learn about our risk management and trading techniques!