Introduction to Candlestick Charting
As a beginner investor, you've most likely heard of a candlestick charts and chart patterns, but you may not fully understand what it means or how to identify these patterns. Learn all about candlestick charts, patterns, and technical analysis in our free candlestick charting guide below.
Candlestick Charting Guide
Whether you're a new investor, a beginner day trader, or a novice swing trader, you've undoubtedly heard of candlestick charts or candlestick chart patterns. In this guide we will show you how vital chart patterns can be to making profitable trades on the stock market.
Aside from having the right charting and trading tools at your disposal, savvy investors also need to have a thorough understanding of what price movements to expect in the future.
Like other charting types, candlestick charts and candlestick patterns can help investors to determine future price movement based on past patterns, enabling them make wiser investment decisions.
Knowing how to interpret chart patterns will help knowledgeable investors determine whether they should go short (when a trader takes a trade wagering the price of a stock will fall) or go long, (which is when a trader buys a stock expecting a move higher in price).
In the following beginner's guide to investing in the stock market, we're exploring the basic principles of the reading candlestick charts.
We'll also cover some of the most common candlestick patterns to watch out for when monitoring the stocks on your watch list.
What Is A Candlestick Chart?
A candlestick chart is the best type of charting to use when day trading, swing trading, or investing in the stock market. It shows more information than a bar chart, for example, as it shows the open price of each candle, the high price, low price, and the close price as shown here:
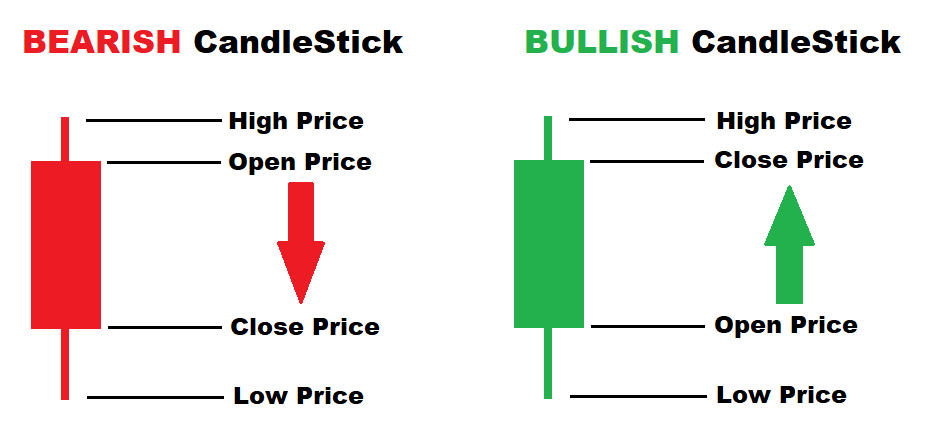
The Anatomy of BEARISH vs BULLISH Candlesticks
Each "candle" is used to describe price fluctuations during a given time period. You can opt to use any time period per candle that you choose. Some common time frames people use are 1 minute, 5 minute, 15 minute, hourly, daily, and weekly chart candles depending on whether you are day trading or swing trading.
Daily CandleStick Chart Example
In the example below, we are looking at a 1 day (daily) chart. Each candle represents one full day of trading over a 3 week period and the price fluctuations during that time. Notice that in this image you can see the high of each day, the low of each day, and the closing price of each day within each candle.
The high is represented by the top of the candle, the low is the bottom of the candle, and the closing price on green candles is the top of the solid green before the "wick" above. The wick shows how high the stock went, the end of the solid bar shows where the price closed during that time period:

ANY Daily Chart Representing 2 weeks of price action
Looking at the image above we can see that on the most recent day of trading the stock traded a high of $7.43, a low of $6.21, and the stock closed at $6.81.
5 Minute Candlestick Chart Example
Below is the same stock, but showing the intraday action (the inside of the last green daily chart candle in the previous example) represented by 5 minute chart candles so we can see exactly what happened during that day of trading.
Each candlestick shows 5 minutes of price action showing the high, low, and close of each 5 minute time period during that entire day:

ANY 5min Chart representing one full day of trading broken down into 5 minute segments - Each candle represents 5 minutes of action
How To Read A Candlestick Chart
As you can see, each candle is made up of two main parts; the rectangular body of the candle, which will either be red or green, and the lines at the top and bottom of the body, which are referred to as the wicks or shadows.
Note that in some charts, a white/empty candle body may represent a green candle, and a black/filled candle may represent a red candle. This can usually be changed within the chart settings.
The candle's body describes the opening and closing price of a stock for a given period, whereas the wicks or shadows at the top and bottom of the candle denote the highest and lowest price of that period.
The more significant the difference between the open and close price, the longer the body of the candlestick will be.
And, the more significant the difference between the period's highest and closing price, the longer the wicks will be.
How to Identify Bullish Candlesticks
When the candlestick's close price is higher than the open price, this results in a green candlestick body.
This is referred to as a bullish candlestick which means that during this time period, the stock closed higher than its starting price.
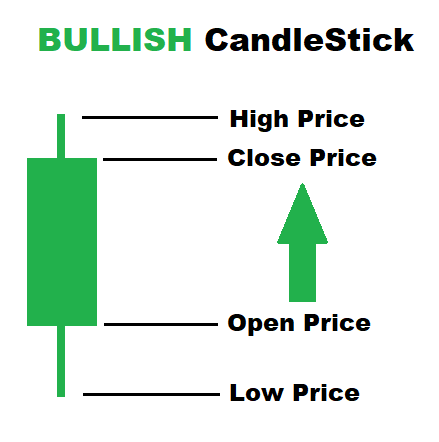
Bullish Candlestick Closes above it open price for that time period
How to Identify Bearish Candlesticks
Alternatively, when the price of a stock closes lower than it opened, you'll see red candlestick, referred to as a bearish candlestick.
Typically, a bearish candlestick means that sellers have been in control during the period and are driving the price lower.

Bearish Candlestick Closes BELOW its open price for that time period.
Identifying Bullish and Bearish Chart Patterns
Like bullish or bearish candles, a series of multiple candles can be used to identify either bullish or bearish chart patterns, which can help investors determine a stock's future price movement.
Bullish Chart Pattern
Now that you know how to identify each candle, lets look at some examples of how these candlesticks come together to form repeatable patterns in the market. For instance, a bullish breakout pattern is a common, easy-to-spot pattern that may indicate an upcoming breakout.

Flag Break / Cup and Candle Breakout Pattern on Daily Chart
In the example above, we are looking at a daily chart (so every candlestick represents a full day of price action).
In this particular trade setup, you can buy the circled candle on that trading day, put a stop loss on the support of the lower candles ($4.00 per share), and hold long for a few days while the price rises. This is a typical bullish chart pattern that can often result in a "breakout" of the stock and give the trader or investor an idea of where to buy and risk from based on the chart setup. .
The exact same pattern can be applied to smaller time frame charts such as a 5 minute chart, for day trading, as seen in the breakout example below:

5 Minute Chart Breakout Pattern
Bearish Chart Pattern
To read a chart and reliably identify a pattern, candlestick analysts need to have a keen eye and a solid knowledge and understanding of recent price movements, as well as knowing what they can deduce from those recent movements.
You can use the same principles as used in the chart above to give you solid indications of when to SELL a stock, or to go short.

5 minute chart reversal pattern
It's often said that predicting stock prices is more of an art than a science, but I disagree. There are repeatable patterns in the market with high win rates. With enough patience, practice, and back-testing, over time, you'll be able to develop your edge and design a more systematic trading system that will help you reduce risk and increase your chances of success.
Who Can Use CandleStick Charts and Patterns
Everyone should use candlestick charts to get the most information possible when making trading or investment decisions. Whether you are a day trader trading from one of the 5 minute chart patterns shown above, or a swing trader trading from the daily chart example , charting and chart patterns are very reliable in predicting future price movements when used properly.
Learn more about developing a trading system based on chart patterns.
The Importance Of Candlestick Patterns
To understand when you should buy or sell, you'll need to comprehend that price movements are always controlled by the never-ending battle between buyers and sellers.
When more investors are buying a stock than there are selling, we can say that the buyers are in control, which drives increasing higher prices.
On the other hand, when more people are selling stock than there are buying, we can say that the sellers are in control, which will drive prices lower.
Once you can identify which party has control of a stock's price, you can learn to recognize the chart patterns forming, and better predict future price movements.
How To Identify A Candlestick Pattern
The abandoned baby? Bullish harami? The rising three? These sound like something out of an astrology book, right? Knowing that there are so many candlestick patterns is enough to overwhelm any beginner investor or trader.
The truth is, you don't need to know the fancy names, you just need to know a few reliable patterns that you can use repeatedly in the market every day.
Note that learning to read candlesticks seems easy when looking back on past charts. But reading charts and predicting price movements in real-time takes a well-trained, professional eye.
Its very helpful to have a professional day trading chat room that calls out and identifies these patterns for you so you can learn them faster!
Learn More about Candlestick Patterns
In this beginner's guide to candlestick patterns, we've covered many of the basic principles investors use to trade profitably on the stock market.
By now, you should have a basic understanding of the principles of candlestick charts, and how price movements are influenced by buying and selling pressure.
The truth is, its good to know what classic candlestick chart patterns mean, but there are only 4 simple patterns that I use in my every day trading which I have used and perfected for years, which are outlined in our free day trading course for members of our trading group.
I hope this guide helps you better understand the fundamentals of using a candlestick chart to predict future price movements. Good luck in your trading!
P.S. - Grab our free Day Trading Video Lesson below!