The Cup and Handle is an age-old trading pattern that still holds relevance to this day. This is because while markets do change, along with some of the effectiveness of strategies, human
nature is fundamentally the same, and so the driving forces of price action can be visually represented through the same repeatable patterns in the stock market.
This pattern was originally coined in 1984 by William J. O’Neil in his infamous trading pattern book “How to Make Money in Stocks”.
Essentially, the pattern is a breakout/continuation setup, in which the price action has a made an initial high and has pulled back and consolidated and formed higher lows as it goes to re-test that high. The price then re-traces once more from those highs, on lighter volume preferably, and then proceeds to go higher on more buying volume which takes it through those highs.
Learn the Pattern
Example 1.
$TSLA intraday Cup and Handle that lead to new highs
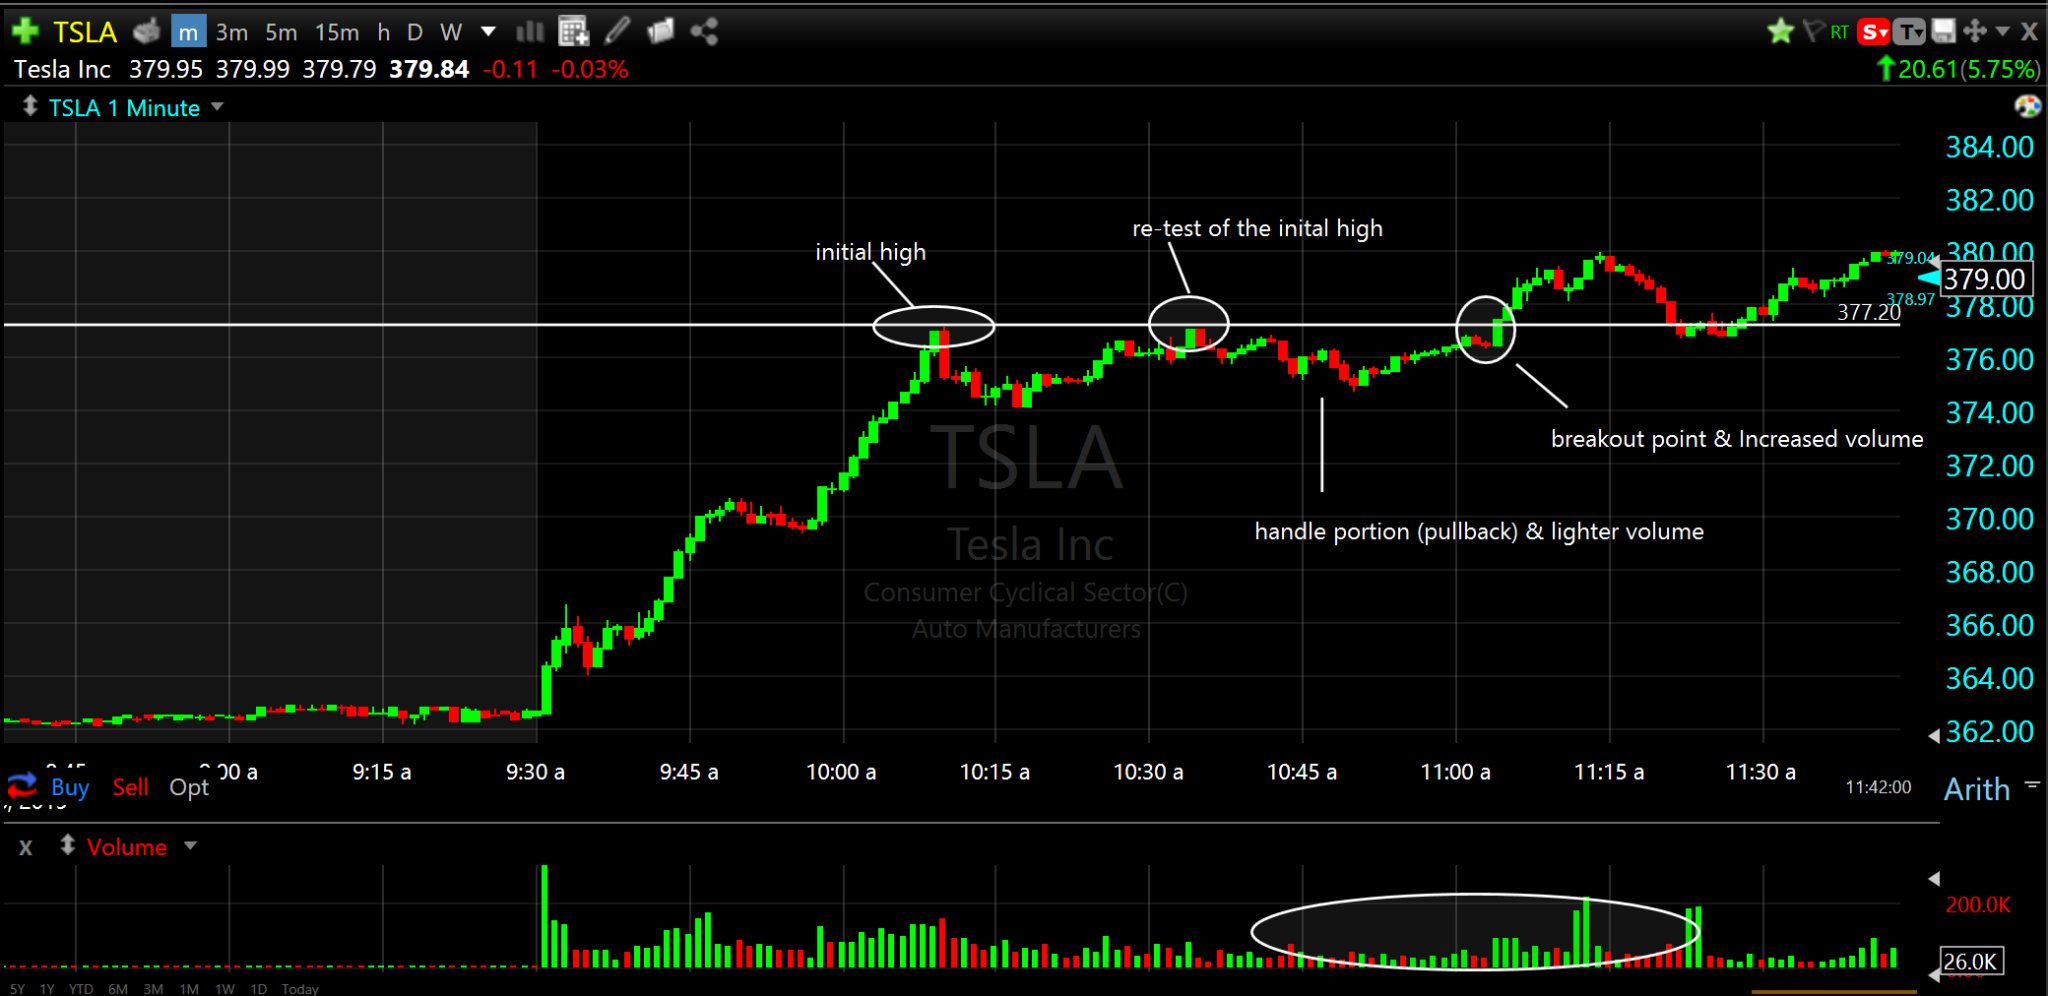
Tesla Cup and Handle
Example 2.
$DRH Cup and Handle on the Daily Chart
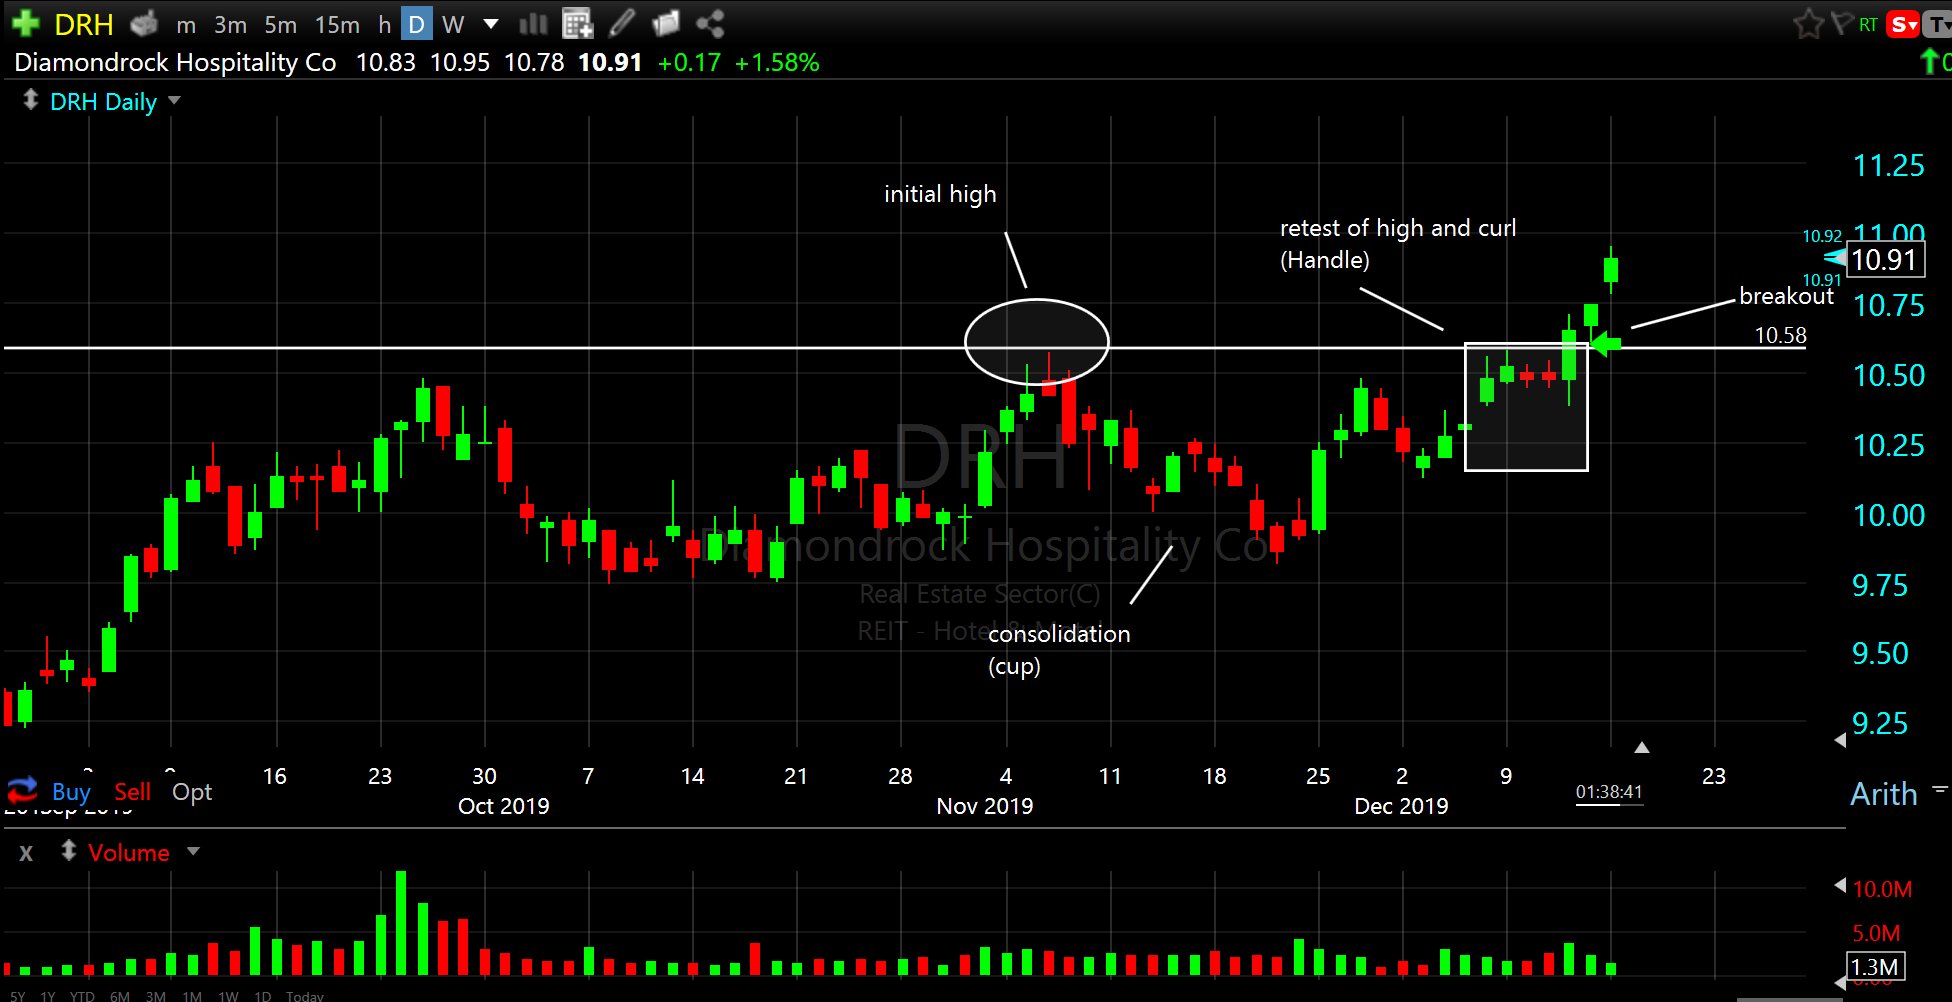
DRH Cup and Handle Breakout Pattern
Example 3
$QCOM Cup and Handle on the Daily Chart

QCOM Cup and Handle Breakout Pattern
Variables to Keep Note of
It is important to note that this pattern can be found on any financial asset and across any time frame. However, there are variables you’d want to consider before taking the signal.
Overall Market Context – Something to consider if you’re trading stocks more correlated to the overall market such as Apple ($AAPL) to the Standard and Poor’s Depositary Receipts ($SPY), is the sentiment of the bigger picture index. If going long a stock, could ask the questions of “How is $SPY behaving? Is it in a range? Is it breaking higher? Is it holding highs? Etc.”.
Having the overall market moving in your direction is an additional confirmation to your trade. Overall Sector Context – Along the same lines as market context, is sector context. If going long
technology stocks, things to consider is how the $QQQ is behaving. There are ETF’s for every sector that can help provide added confirmation to a directional trade and to tell you if you’re
going with or against the sector sentiment.
Overall Asset’s Context – This is probably more important than the previous two and it’s the stock’s own context. Many traders try to trade every cup and handle and come out net loss. A big reason is due to taking cup and handles on a stock that’s no longer in a bullish trend. Trying to buy a stock that has broken its trend is fighting against the market and unless you have enough money to move prices in your favour at will, you’re better off playing with the trend.
The Trend is Your Friend
Finding cup and handles and any long patterns that are in unison with the trend, and better yet after a correction and re-confirmation of the trend will yield the best results.
Know Your Time-Frame
– It would be very hard to predict a 6-month breakout move from a 1-minute chart, so know your time frame. The longer the time frame the setup is forming on, the bigger the
potential move that can take place.
The shorter the time-frame, the smaller the move (relative to bigger time frames).
Pro Tip: Finding setups, such as the Cup and Handle, on bigger time-frames and playing them intra day, along with an intra day bullish setup is the perfect scenario to have multiple technical catalysts that would support your thesis/trade. For more on this, please see our blog post on trading multi time frame breakouts.
Volume – Volume is a measure of the buying/selling and shorting/covering taking place. In general, you want to see heavy volume moving in the direction of your trade and lighter volume
against it. So, on the Cup and Handle, you’d want to see lighter volume when it’s forming the handle and heavier volume as it pushes higher and breaks out.
Conclusion
This is just one example of a trading pattern that can be effectively leveraged as an edge if cultivated with the right set of rules and criteria, like that of which we provide to our students at Livestream Trading.
A trading setup working or failing is ultimately up to the rules that the trader abides by, so finding the right set of criteria for your trades is the key to finding trading success. At Livestream Trading, we provide all our members with our full trading course FREE upon sign up, that gives you the A through Z of everything you need to know to execute our proven and systematic trading setups. Click here to get started with our FREE Systematic Trading Course for members!
Learn How To DayTrade Stocks with LIVE trades, daily training webinars, and our FREE systematic trading course for members.
Get our free Video Lesson on how to trade our favorite breakout pattern!